jeudi 7 avril 2011

Inserting DNA molecules

A little detailed review with primer testing using Sybr Green intercalating dye for non specific amplification. Here are few explanations about it and other similar solution available :

- SybrGreen : assymetric cyanine that inserts itself into the double strand DNA little groove. When inserted, it emits a fluorescence at 525nm wavelength, usable at FAM channel in a PCR platform. SybrGreen is the most used dye in non specific qPCR and have very strong fluorescence intensity. It gives two different types of information : Target quantity with curves correlated to calibration curves and amplicon quality with melting curves. This last type of curve is obtained by doing a additional amplification program to amplification one (pretty easy to setp tup, ask if you do not find one) and give, after data analysis, the amplicon Tm depending of its size and base composition. Every different amplicon will have a different Tm.


Resolight (Roche) or LC green (for HRM application) : HRM (for High Resolution Melting) is a technology using next generation of intercalating dye inserting more efficiently in the DNA groove than SybrGreen. Indeed, whereas SybrGreen insert itself every 5 to 8 bases among DNA groove, HRM dyes (like LC green) insert in contiguous way and leave no gaps in insertion. Thus, single base mutation or little sequence difference are detected more easily with a fully inserted dye. That is why genotyping has made so huge advance since this technology has appeared. A single mutation can be detected because it will modify the Tm. Used wavelength are around 480nm excitation and 520nm emission.


Boxto : molecule from assymetric cyanines family like BEBO, occurs like Sybr Green. I do not know the intercalating density of this molecule but seems to be similar to SybrGreen. What is the interest so?
Its absorption/emission spectra is not close from FAM one (480/530bm) but closer to HEX/VIC one (520/560nm). This is very interesting used with FAM grafted probes because it allows to do a target amplification with FAM and to check primer-dimer formation and amplicon type adding BOXTO to do a melting curve step. And because emission spectra are different enough, this will not give any problem for analysis considering overlapping. And it WORKS !!!
This molecule can be found at TATAA biocenter
(http://www.tataa.com/webshop/Dyes/BOXTO/Detailed-product-flyer.html)

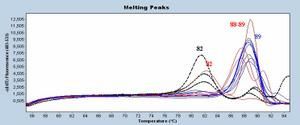
Hereunder a little assay made several months ago. One target but 4 differents intercalating dyes or kits comprising a specific dye :
- Boxto (red) : weak signal but it is normal considering that the analysis here is made with FAM channel instead of VIC normal one.
- Resolight (blue) : from Roche master mix
- MESA Green (black) : Sybr Green solution optimized by Eurogentec
- SybrGreen (green) : from Roche master mix


Figure show us that obtained Tm are almost similar but not completely. Resolight gives the finest values and strong fluorescence having a better sensitivity than the others. Boxto gives good information even not analyzed with the right channel. The two other does not give better results than another.
For next experiments, I will use Resolight more often and also Boxto from time to time with the ability to do melting curve with FAM target system amplified.

Waiting for that, have good curves and be bright...

Primer testing

That is the first article where we will talk really about primers and how to chose the best ones considering the obtained results.

Actually, as said previously, no good PCR without good primers, that is the base.
But how testing primers in qPCR without flurorescent probes? Here are the intercalating DNA dyes domains and non specific qPCR...and among them Sybr Green, LC Green, Resolight, Syto9 and few others cyanins.

In order to test primers, we can use intercalating DNA dyes, fluorescent molecules about to hybridize themselves to double strand DNA coming from PCR reaction itself. They insert in the set up DNA groove and give fluorescent only at this moment. Because fluorescence signal is proportionnal to double strand set up DNA quantity, we have amplification curve relating the signal increase compared to cycle evolution.

Herein an example of a primers system research for a specific target


It can be seen the B system in red and A system in black, targets and concentrations are similar in this experiment.
We could conclude that B system has sooner Ct than A system, meaning that the DNA quantity is better.
Nevertheless, B system gets a constant increase of fluorescent signal even without PCR exponential amplification. This shape means a trouble in the reaction between the compounds (primers, thermoprofile to be changed, interaction within PCR kit) and for this, the A system should be preferred.

When I had this trouble of residual increasing fluorescent signal, change of PCR kit supplier always resolved the troubel itself, especially for Sybr Green . The main trouble is that is not only because of one supplier material but from interaction of different compounds.

Once amplification curves are set up, one of the best interest in this expériment is Melting curve. After a short added program added following PCR one (95°C denaturation, temperature drop to 55°C in general corresponding to hybridization then increasing of temperature degree by degree taking in the same time more fluorescent signal information than usually. The so-called Tm is the temperature when half of the amplicons quantity formed by PCR reaction are dissociated.

This Tm is directly linked to amplicon composition to be studied (basis composition, length..) and that is how we should do the difference between two of them. The melting curve analysis is usually made with another part of the software to get a graph with fluorescence decrease on y axis and increasing T) on x axis. Then, a derivative analysis is made from these curves, we get a sort of chromatogram (see under with Sybr Green)


Obtained T° peaks corresponds to set up amplicons. When only one target is made, only one peak is formed (like blue curves on the figure). You can also get peaks and shoulders (red curves) corresponding to targets close to the good one but with genetic sequence different in composition and/or length within a same sample. A last example can be seen, the one of primer-dimers, primers that auto-hybridize and making non specific amplicon (smaller, so with a smaller Tm), here colored in dashed black.

Primer-dimers can be avoided first with the help of adapted design software before ordering. Nevertheless, primer-dimers can still occur in tested systems. They can be seen among Negative control, because they have not got any "competitive" reaction and can occur more easily. When a target amplification occur, they are quite often unseen.

These primers-dimers are easily recognizable because they occur in negative control wells, but also because they have a lower Tm than target system. In the previous figure, dimer Tm is about 82°C for a target system around 89°C.
Hereunder, another system than the previous one but with the same DNA samples tested show us that target curves are better and it remains only one primer-dimer among all the tested negative control (more easy to get rid of adding a probe in the system, but that topic will be discussed in a next post).


In conclusion, it is clever to test at least 2 different system for an identified gene target with different Master Mix PCR supplier. Try not to be stuck with only one supplier or reference, composition and Taq processivity can change drastically your results.
In a next post, I will talk about intercalatinng dyes that I tested in my lab. And, believe me, here again, many difference can occur considering one dye to another.
Have a good curve...

mercredi 30 mars 2011

Primers and probe design

Here we are…

To be clear, before talking about optimization steps, tests, calibration curves, trueness, validation and inhibition, PCR needs a primer and probe system to work and ensuring targeted gene detection.

So, detection strategy is crucial.

Working in microbiology field with bacteria, viruses and others, I will obviously pick up examples from personal results collected for several years now.


Nevertheless, working on pretty confidential fields in a private company, I will rarely give precised details or goals of the results… I think you will understand…

Let is back to development strategy. Many ways are possible but I can see mainly 2 considering detection and quantification in microbiology field.

The first targets a genus for example, so it has to detect any forms, serotypes or genogroupes and gives a so called “consensus system” even excluding any other microorganism. The second one targets a precised microorganism excluding all the other, one of the most known is Legionella pneumophila.


Thus, considering the 2 strategies, a gene has to be found comprising conserved regions among the different targeted microorganisms (consensus, strategy 1) or a gene comprising mutations in order to discriminate targeted one from all the others.

It foresees many hours looking for good sequences in online database, to compare them and to chose the right one with the right software…or doing it manually with the alignment and operator feeling and knowledge.

Firstable, the NCBI website is inevitable for search of sequences and references.

The approach is simple but can also takes time if meticulous.


1) Search on targeted microorganism in PubMed and also PCR development or genome studies.

2) Find all complete or partial sequences of our target (consensus or specific one).
For example, if you look for Legionella pneumophila on NCBI genome, 45 complete sequences (CDS) will be found. All of them are not Legionella pneumophila because we can have similitude or partial identical sequence. Nevertheless, we can also found the complete Lp1 Philadelphia sequence for example.


3) Back to « Nucleotides » results (more than 3000 items), partial sequences can be also looked for.

4) Once good sequences are found, alignments has to be done to compare them. Many websites are dedicated to it or also softwares like BioEdit
- Multalin
- Clustal software
- A pretty good list is done on Wiki links but as I do not know all of them, be careful about it ("List of sequence alignment software")


5) When a sequence is interesting about alignments and locus, primers and probe has to be determined (next post). Basically, either you have a very powerful up-to-date software like PrimerExpress from ABI, Oligosys or Beacon Designer or you can use free online software like Primer3.

Parameters are complete to change, but you need to know absolutely what you do before changing any of them, because it can affect deeply the obtained results.

6) When primers are chosen, it is good to check with which sequences it can match. Indeed, goals of these oligos is to specifically amplify the target and not the others.

Thus, the use of BLAST (Basic Local Alignment and Search Tool) software permits to check matching one more time of our chosen primers to any other sequences available in the database. It is a good step to check whether sequences are good or not.

Go on "Nucleotide Blast" and then :
- Paste your sequences in the first window

- Name you search in « Job title »
- Indicate the database you want to match your sequence with (on my point of view, it was mainly versus "nucleotide collection nr/nt").
- Optimize your search (in general I work with Blastn)

The obtained results comprises the first 100 results

- Access number of the answer

- Description (name of the matched target)

- Blast scores

- Recovery percentage

- E-value (the smaller, the better..)

If your target is the only 100% found sequence, it is very good.

If not, have a look to the sequences and evaluate the amplification risk of a non-targeted microorganism

7) Another interesting step is to study the chosen sequences with FASTA comparison software.

It will align both sequences and being able to find mutations.

Then, this in silico evaluation is done, and time has come for primers and probes order. Considering probe strategy, it will be discussed in a next post.

Oligos company are present on the market. As for me, I have good results with MWG-Eurofins and Eurogentec.
I always start development with a 0.2µmole order for primers and probes. If you order only primers, you will get them in less than one week.

Next posts will be on primers testing.

Have a good amplification