Actually, as said previously, no good PCR without good primers, that is the base.
But how testing primers in qPCR without flurorescent probes? Here are the intercalating DNA dyes domains and non specific qPCR...and among them Sybr Green, LC Green, Resolight, Syto9 and few others cyanins.
In order to test primers, we can use intercalating DNA dyes, fluorescent molecules about to hybridize themselves to double strand DNA coming from PCR reaction itself. They insert in the set up DNA groove and give fluorescent only at this moment. Because fluorescence signal is proportionnal to double strand set up DNA quantity, we have amplification curve relating the signal increase compared to cycle evolution.
Herein an example of a primers system research for a specific target

It can be seen the B system in red and A system in black, targets and concentrations are similar in this experiment.
We could conclude that B system has sooner Ct than A system, meaning that the DNA quantity is better. Nevertheless, B system gets a constant increase of fluorescent signal even without PCR exponential amplification. This shape means a trouble in the reaction between the compounds (primers, thermoprofile to be changed, interaction within PCR kit) and for this, the A system should be preferred.
When I had this trouble of residual increasing fluorescent signal, change of PCR kit supplier always resolved the troubel itself, especially for Sybr Green . The main trouble is that is not only because of one supplier material but from interaction of different compounds.
Once amplification curves are set up, one of the best interest in this expériment is Melting curve. After a short added program added following PCR one (95°C denaturation, temperature drop to 55°C in general corresponding to hybridization then increasing of temperature degree by degree taking in the same time more fluorescent signal information than usually. The so-called Tm is the temperature when half of the amplicons quantity formed by PCR reaction are dissociated.
This Tm is directly linked to amplicon composition to be studied (basis composition, length..) and that is how we should do the difference between two of them. The melting curve analysis is usually made with another part of the software to get a graph with fluorescence decrease on y axis and increasing T) on x axis. Then, a derivative analysis is made from these curves, we get a sort of chromatogram (see under with Sybr Green)
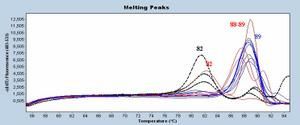
Obtained T° peaks corresponds to set up amplicons. When only one target is made, only one peak is formed (like blue curves on the figure). You can also get peaks and shoulders (red curves) corresponding to targets close to the good one but with genetic sequence different in composition and/or length within a same sample. A last example can be seen, the one of primer-dimers, primers that auto-hybridize and making non specific amplicon (smaller, so with a smaller Tm), here colored in dashed black.
Primer-dimers can be avoided first with the help of adapted design software before ordering. Nevertheless, primer-dimers can still occur in tested systems. They can be seen among Negative control, because they have not got any "competitive" reaction and can occur more easily. When a target amplification occur, they are quite often unseen.
These primers-dimers are easily recognizable because they occur in negative control wells, but also because they have a lower Tm than target system. In the previous figure, dimer Tm is about 82°C for a target system around 89°C.
Hereunder, another system than the previous one but with the same DNA samples tested show us that target curves are better and it remains only one primer-dimer among all the tested negative control (more easy to get rid of adding a probe in the system, but that topic will be discussed in a next post).

In conclusion, it is clever to test at least 2 different system for an identified gene target with different Master Mix PCR supplier. Try not to be stuck with only one supplier or reference, composition and Taq processivity can change drastically your results.
In a next post, I will talk about intercalatinng dyes that I tested in my lab. And, believe me, here again, many difference can occur considering one dye to another.
Have a good curve...
Aucun commentaire:
Enregistrer un commentaire